In recent decades in the United States, heat waves have been far less frequent and severe than they were in the 1930s.
The all-time high temperature records set in most states occurred in the first half of the twentieth century.
The most accurate nationwide temperature station network, implemented in 2005, shows no sustained increase in daily high temperatures in the United States since at least 2005.
Short Summary:
Heatwaves have always been a natural part of the American climate. Global warming will not put an end to heatwaves. However, global warming is not making heatwaves much worse, either, if at all. That is because the lion’s share of the Earth’s modest warming occurs during winter, at night, and closer to the poles.
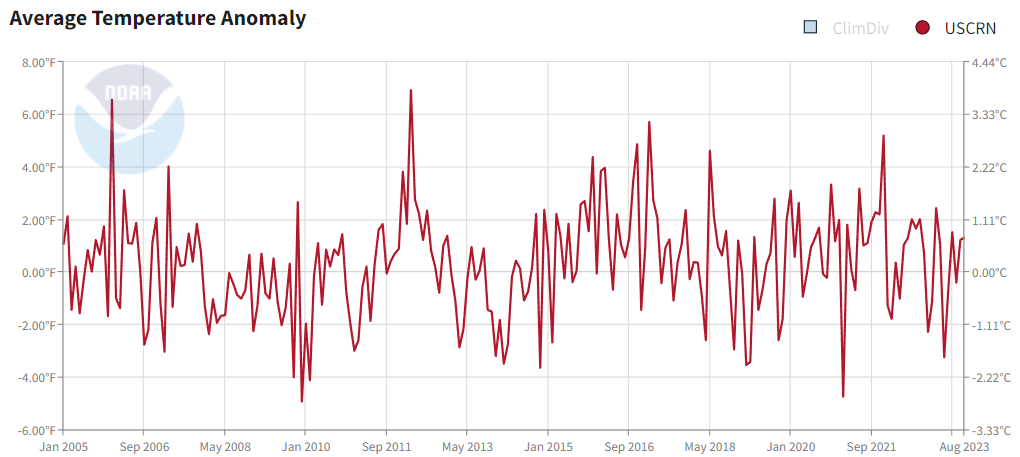
As Figure 1 shows, there has been no sustained increase in daily high temperatures since at least 2005, when the National Oceanic and Atmospheric Administration launched its most accurate temperature station network, the Climate Reference Network.1,2
Figure 1. Contiguous U.S. High Temperature Anomalies
Figure 1, High surface temperature anomalies in the United States, January 2005 to February 2022. Source: U.S. Climate Reference Network, “Average Surface Temperature, January 2005 to February 2022 ,” ncdc.noaa.gov, National Climatic Data Center, National Oceanic and Atmospheric Administration, last accessed September 27, 2023, https://bit.ly/3JZfqzg
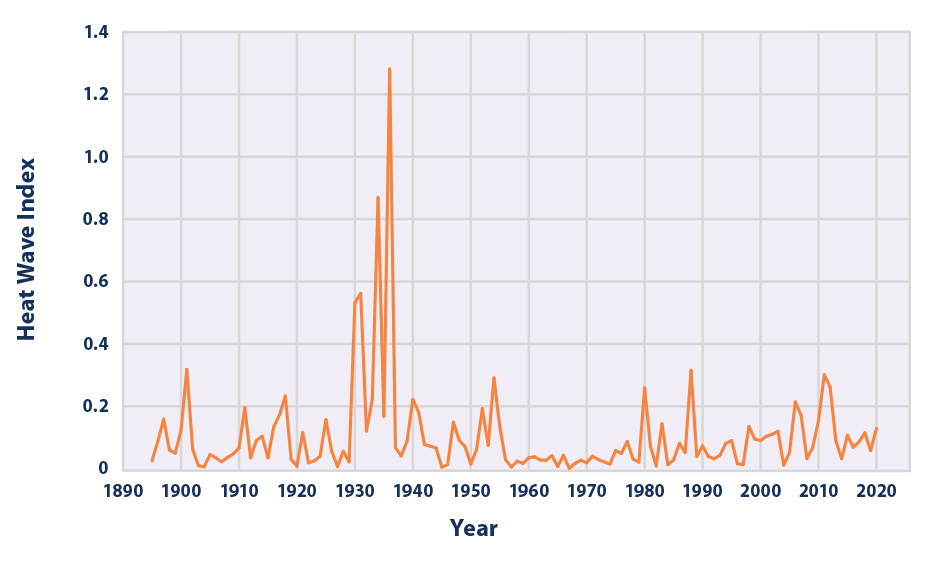
Further, the data illustrated in Figure 2 show extended periods of very high temperatures were much more common in the 1930s than they have been in the present decade. Moreover, recent heat wave frequency and intensity remain in line with the historical norm.
Objective data show the all-time high temperature records set in most states occurred in the first half of the twentieth century, decades before anyone was talking about man-caused climate change.3
Figure 2. Heat Wave Index for the Contiguous United States, 1895–2020
Figure 2. This figure shows the annual values of the U.S. Heat Wave Index, from 1895 to 2020. These data cover the contiguous 48 states. This index defines a heat wave as a period lasting at least four days with an average temperature that would only be expected to occur once every 10 years, based on the historical record. The index value for a given year depends on how often heat waves occur and how widespread they are. Source: Graph from Environmental Protection Agency, “Climate Change Indicators: Heat Waves,” accessed August 14, 2021, https://www.epa.gov/climate-indicators/climate-change-indicators-heat-waves#%20. Data Source: K. Kunkel, Figure 2.3 in “Weather and Climate Extremes in a Changing Climate,” U.S. Climate Change Science Program: Synthesis and Assessment Product 3.3, originally published in 2008, updated in 2021, accessed August 14, 2021, www.globalchange.gov/browse/reports/sap-33-weather-and-climate-extremes-changing-climate
References:
U.S. Climate Reference Network, National Oceanic and Atmospheric Administration’s (NOAA) National Centers for Environmental Information, accessed August 17, 2021, https://www.ncdc.noaa.gov/crn
U.S. Climate Reference Network, “Average Surface Temperature, January 2005 to July 2021,” ncdc.noaa.gov, National Climatic Data Center, National Oceanic and Atmospheric Administration, last accessed March 31, 2022, https://bit.ly/3JZfqzg
Patrick Michaels, “Newly Found Weather Records Show 1930s as Being Far Worse than the Present for Extreme Weather,” World Climate Report, reposted to Watts Up with That, wattsupwiththat.com, July 14, 2012, https://bit.ly/3k8OIIN
In recent decades in the United States, heat waves have been far less frequent and severe than they were in the 1930s.
The all-time high temperature records set in most states occurred in the first half of the twentieth century.
The most accurate nationwide temperature station network, implemented in 2005, shows no sustained increase in daily high temperatures in the United States since at least 2005.
Short Summary:
Heatwaves have always been a natural part of the American climate. Global warming will not put an end to heatwaves. However, global warming is not making heatwaves much worse, either, if at all. That is because the lion’s share of the Earth’s modest warming occurs during winter, at night, and closer to the poles.
As Figure 1 shows, there has been no sustained increase in daily high temperatures since at least 2005, when the National Oceanic and Atmospheric Administration launched its most accurate temperature station network, the Climate Reference Network.1,2
Figure 1. Contiguous U.S. High Temperature Anomalies
Figure 1, High surface temperature anomalies in the United States, January 2005 to February 2022. Source: U.S. Climate Reference Network, “Average Surface Temperature, January 2005 to February 2022 ,” ncdc.noaa.gov, National Climatic Data Center, National Oceanic and Atmospheric Administration, last accessed September 27, 2023, https://bit.ly/3JZfqzg
Further, the data illustrated in Figure 2 show extended periods of very high temperatures were much more common in the 1930s than they have been in the present decade. Moreover, recent heat wave frequency and intensity remain in line with the historical norm.
Objective data show the all-time high temperature records set in most states occurred in the first half of the twentieth century, decades before anyone was talking about man-caused climate change.3
Figure 2. Heat Wave Index for the Contiguous United States, 1895–2020
Figure 2. This figure shows the annual values of the U.S. Heat Wave Index, from 1895 to 2020. These data cover the contiguous 48 states. This index defines a heat wave as a period lasting at least four days with an average temperature that would only be expected to occur once every 10 years, based on the historical record. The index value for a given year depends on how often heat waves occur and how widespread they are. Source: Graph from Environmental Protection Agency, “Climate Change Indicators: Heat Waves,” accessed August 14, 2021, https://www.epa.gov/climate-indicators/climate-change-indicators-heat-waves#%20. Data Source: K. Kunkel, Figure 2.3 in “Weather and Climate Extremes in a Changing Climate,” U.S. Climate Change Science Program: Synthesis and Assessment Product 3.3, originally published in 2008, updated in 2021, accessed August 14, 2021, www.globalchange.gov/browse/reports/sap-33-weather-and-climate-extremes-changing-climate
References:
U.S. Climate Reference Network, National Oceanic and Atmospheric Administration’s (NOAA) National Centers for Environmental Information, accessed August 17, 2021, https://www.ncdc.noaa.gov/crn
U.S. Climate Reference Network, “Average Surface Temperature, January 2005 to July 2021,” ncdc.noaa.gov, National Climatic Data Center, National Oceanic and Atmospheric Administration, last accessed March 31, 2022, https://bit.ly/3JZfqzg
Patrick Michaels, “Newly Found Weather Records Show 1930s as Being Far Worse than the Present for Extreme Weather,” World Climate Report, reposted to Watts Up with That, wattsupwiththat.com, July 14, 2012, https://bit.ly/3k8OIIN